- Alaskan Yachts
- Azimut Yachts
- Back Cove Yachts
- Beneteau Yachts
- Benetti Superyachts
- Bertram Yachts
- Boston Whaler
- Broward Yachts
- Buddy Davis Sportfish
- Burger Yachts
- Cabo Yachts
- Catamarans
- Carver Motoryachts
- Center Console
- Chris-Craft Yachts
- Cruisers Yachts
- DeFever Trawlers
- Dufour Sailboats
- Fairline Yachts
- Feadship Yachts
- Ferretti Yachts
- Formula Yachts
- Fountaine Pajot Cats
- Grady-White
- Grand Banks Trawlers
- Hargrave Yachts
- Hatteras Yachts
- Hinckley Picnic Boats
- Horizon Yachts
- Hydra-Sports
- Intrepid Boats
- Jarrett Bay Sportfish
- Jeanneau Yachts
- Kadey-Krogen Trawlers
- Lazzara Yachts
- Luhrs Sportfish
- Marlow Yachts
- Maritimo Yachts
- Marquis Yachts
- McKinna Motoryachts
- Meridian Yachts
- Midnight Express
- MJM Yachts
- Mochi Craft
- Neptunus Motoryachts
- Nordhavn Trawlers
- Nordic Tugs
- Ocean Alexander Yachts
- Offshore Yachts
- Outer Reef
- Oyster Sailing Yachts
- Pacific Mariner Yachts
- Palmer Johnson Yachts
- Pershing Yachts
2018 2nd Quarter Market Report for Sold Yachts

July 13, 2018 8:58 am
- Share
-

-

-

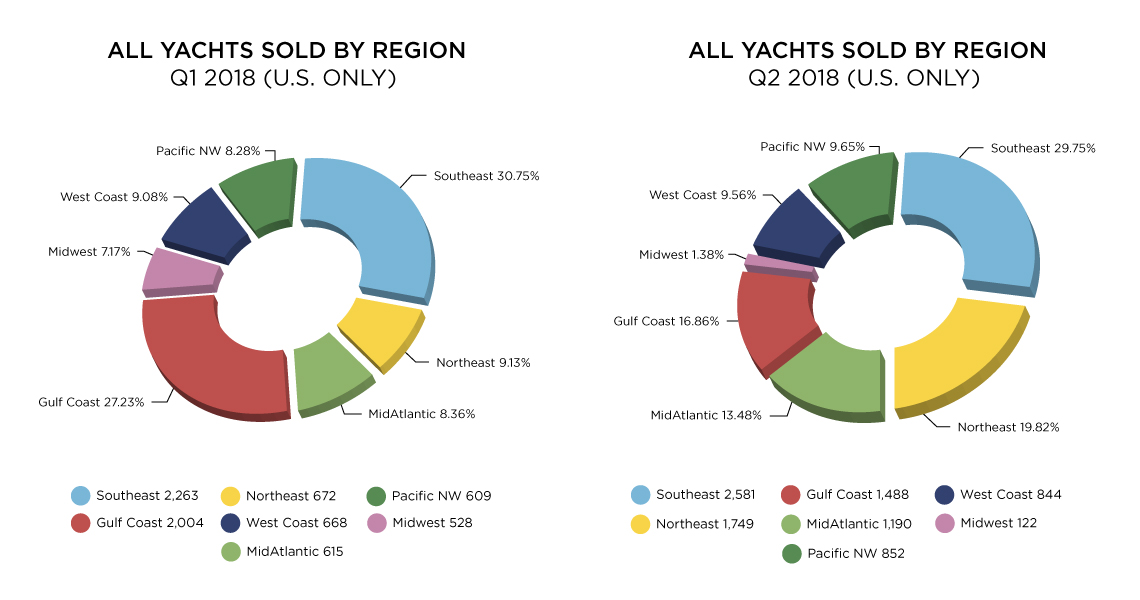
The second quarter of 2018 in the yachting industry revealed some interesting data, with the numbers showing a rather large increase in sold yachts – as sales were up 17 percent in the U.S. over Q1 2018.
The tally of yachts sold took the biggest leap in the Northeast, where sales were up nearly 11 percent from the first quarter of 2018. The Mid-Atlantic region enjoyed a strong increase as well, with sales climbing more than 5 percent, while the Pacific Northwest eked out just over 1 percent in growth, compared to the Gulf Coast, which fell behind significantly, dropping about 11 percent since the end of 2018’s first quarter.
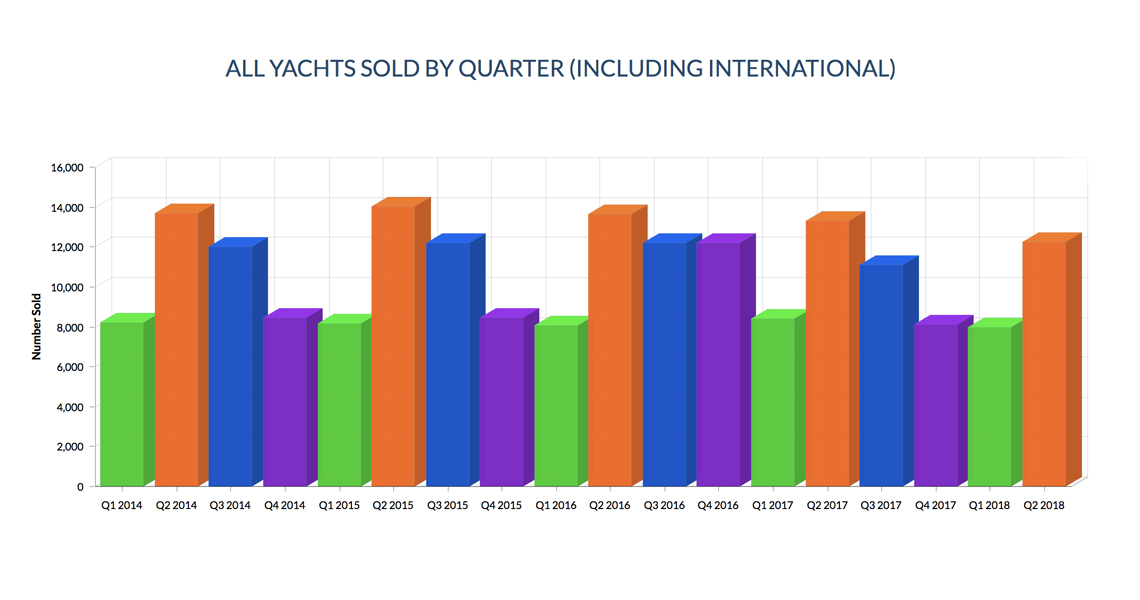
Looking at the wider boat market, the bar graph below highlights all reported boats sold (US and International by quarter). As with previous years, the global trend of a sharp increase in reported sales from Q1 to Q2 continues with a 35 percent jump.
- Q2 2018: 8,904
- Q2 2017: 9,788
- Q2 2016: 10,056
- Q2 2015: 10,559
- Q2 2014: 10,582
- Q2 2013: 10,935
Taking a closer look at the second quarter’s sales regionally in the U.S., we note there has been a declining trend since 2013, when sales were close to 11,000 units in that period, versus 2018, when the reported sales are less than 9,000. Although this seems alarming, the overall market is only marginally down year over year with a 2.2 percent drop.
The second half of 2018 will be both interesting and telling as we move into the summer months and beyond into the Fall Boat Show Season. We will be reporting on Q3 2018 later in the year and taking a closer look at the large yacht sales (80ft and above), which is a fascinating segment of the market.
Stay tuned.
Latest News


