- Alaskan Yachts
- Azimut Yachts
- Back Cove Yachts
- Beneteau Yachts
- Benetti Superyachts
- Bertram Yachts
- Boston Whaler
- Broward Yachts
- Buddy Davis Sportfish
- Burger Yachts
- Cabo Yachts
- Catamarans
- Carver Motoryachts
- Center Console
- Chris-Craft Yachts
- Cruisers Yachts
- DeFever Trawlers
- Dufour Sailboats
- Fairline Yachts
- Feadship Yachts
- Ferretti Yachts
- Formula Yachts
- Fountaine Pajot Cats
- Grady-White
- Grand Banks Trawlers
- Hargrave Yachts
- Hatteras Yachts
- Hinckley Picnic Boats
- Horizon Yachts
- Hydra-Sports
- Intrepid Boats
- Jarrett Bay Sportfish
- Jeanneau Yachts
- Kadey-Krogen Trawlers
- Lazzara Yachts
- Luhrs Sportfish
- Marlow Yachts
- Maritimo Yachts
- Marquis Yachts
- McKinna Motoryachts
- Meridian Yachts
- Midnight Express
- MJM Yachts
- Mochi Craft
- Neptunus Motoryachts
- Nordhavn Trawlers
- Nordic Tugs
- Ocean Alexander Yachts
- Offshore Yachts
- Outer Reef
- Oyster Sailing Yachts
- Pacific Mariner Yachts
- Palmer Johnson Yachts
- Pershing Yachts
S&P 500 and Boat Sales Trend Report

June 2, 2016 7:14 am
- Share
-

-

-

In this new series, we will share our findings from an analysis of U.S. boat sales data and other economic metrics, such as real estate, stock markets, and other industry performance measures.
We believe that the best way to understand the data is to visualize it. In this post, we will show the relationship between boat sales trends and the S&P 500 Index.
Let’s start with a general graph of all used boats sold in the U.S. in the last 10 years:
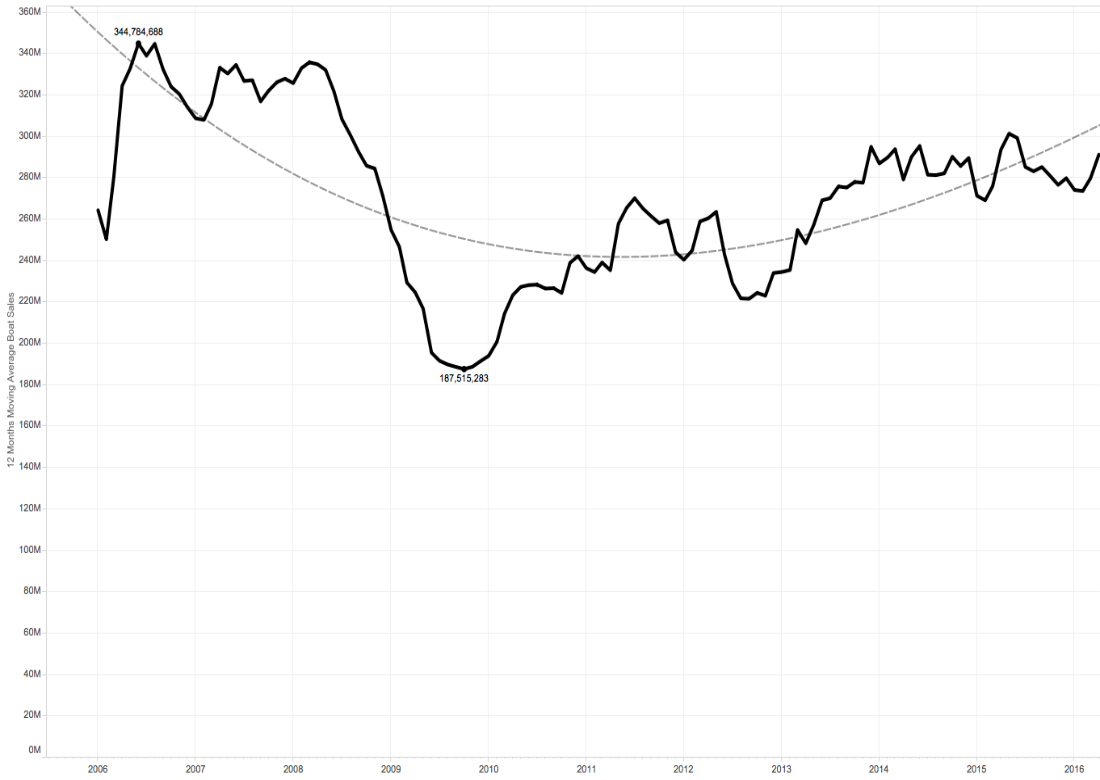
To minimize the influence of seasonality, we use a 12-month moving average calculation. In this graph of average monthly sales, we can clearly see a dramatic drop in 2008-2009 and slow but consistent recovery afterward, with the highest point in June 2006 and the lowest in November 2009.
Now, let’s take a look at the two graphs together:
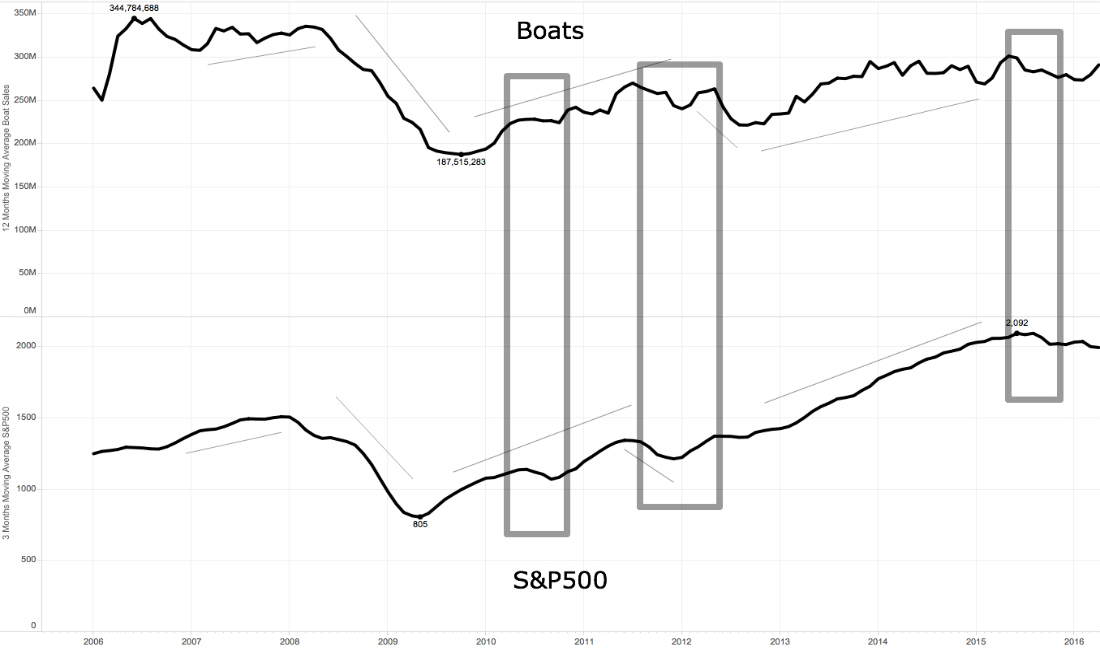
For boat sales, we continue to use the 12-month average, and for the S&P 500 we used a 3-month average. The lowest points of both are in the middle of 2009, but the highest points differ, as boat sales have not completely come back to pre-recession levels.
The highlighted areas demonstrate clear correlations between the two, so we can conclude that the general market trends directly influence the boat sales. Also, the long-term trend lines of both are almost identical.
While the S&P 500 might not be the single-most useful metric to predict future boat sales, it is a good indicator of a current general trend. In upcoming posts, we will continue to examine the relationships between yachts, indexes, and other industries.
Latest News

NEWS | April 26, 2024
Under Construction: 198′ Leapher HORIZON, Exclusive Listing with Denison
Read More >
NEWS | April 25, 2024
Conrad Shipyard Christening Ceremony for C144S Hull #2 EXTRA TIME in Poland
Read More >