- Alaskan Yachts
- Azimut Yachts
- Back Cove Yachts
- Beneteau Yachts
- Benetti Superyachts
- Bertram Yachts
- Boston Whaler
- Broward Yachts
- Buddy Davis Sportfish
- Burger Yachts
- Cabo Yachts
- Catamarans
- Carver Motoryachts
- Center Console
- Chris-Craft Yachts
- Cruisers Yachts
- DeFever Trawlers
- Dufour Sailboats
- Fairline Yachts
- Feadship Yachts
- Ferretti Yachts
- Formula Yachts
- Fountaine Pajot Cats
- Grady-White
- Grand Banks Trawlers
- Hargrave Yachts
- Hatteras Yachts
- Hinckley Picnic Boats
- Horizon Yachts
- Hydra-Sports
- Intrepid Boats
- Jarrett Bay Sportfish
- Jeanneau Yachts
- Kadey-Krogen Trawlers
- Lazzara Yachts
- Luhrs Sportfish
- Marlow Yachts
- Maritimo Yachts
- Marquis Yachts
- McKinna Motoryachts
- Meridian Yachts
- Midnight Express
- MJM Yachts
- Mochi Craft
- Neptunus Motoryachts
- Nordhavn Trawlers
- Nordic Tugs
- Ocean Alexander Yachts
- Offshore Yachts
- Outer Reef
- Oyster Sailing Yachts
- Pacific Mariner Yachts
- Palmer Johnson Yachts
- Pershing Yachts
Real Estate and Boat Sales Trend Report

June 2, 2016 2:19 pm
- Share
-

-

-

In our previous post, we examined the correlation between the S&P 500 Index and boat sales in the U.S. for last 10 years. Today, we want to share with you some comparisons to the real estate market.
Let’s take a look at boats and new home sales greater than $300K in the U.S. In order to take out seasonality factors, we computed the 12-month moving average for boat sales and 6-month moving average for new home sales:
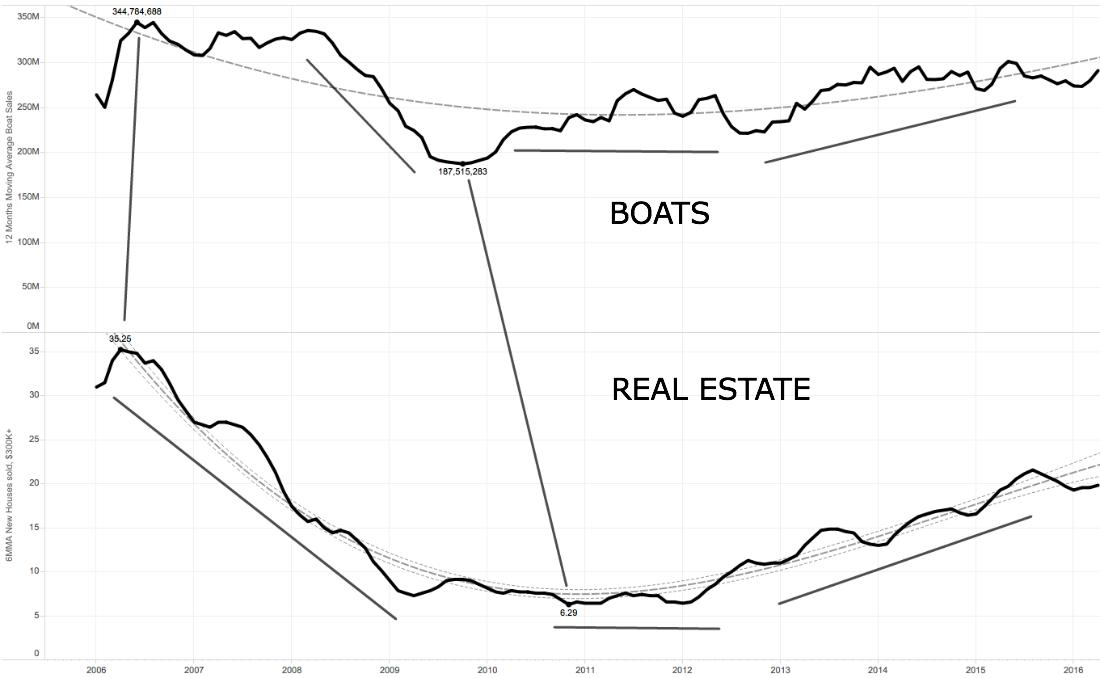
In this graph we can see that the highest and the lowest points are very close in the timeline for both metrics and the trend lines have similar directions. However, this data suggests a very general correlation between the two and cannot be used as a short-term forecast of boat sales.
Latest News

NEWS | April 26, 2024
Under Construction: 198′ Leapher HORIZON, Exclusive Listing with Denison
Read More >
NEWS | April 25, 2024
Conrad Shipyard Christening Ceremony for C144S Hull #2 EXTRA TIME in Poland
Read More >